Our Services
Our Services
Our Services
%20larger%20bo.png)
Hydrogen-Induced Stress Cracking of Swaged Super Duplex Stainless Steel Subsea Components
Abstract
A recent subsea failure of two subsea connectors made of UNS S32760, a 25 wt% Cr super duplex stainless steel, led to an extensive root cause failure analysis. The components showed a single longitudinal crack along a swaged section, which arrested toward its thicker end. The brittle nature of the fracture surface, calcareous deposits on the component, and exposure to cathodic protection suggested hydrogen induced stress cracking—a form of environmentally assisted cracking—as a plausible failure mechanism. Thus, the three causative factors promoting hydrogen-induced stress cracking, namely, a susceptible microstructure, a hydrogen bearing environment, as well as sufficiently high applied and residual stresses in the material were the focus of this investigation.
This work details the material characterization work and presents a possible failure mechanism. The results showed that the failure developed from a combination of factors, typical for hydrogen induced stress cracking. The measured hydrogen content in parts of the material exceeded 40 ppm, more than an order of magnitude higher than what is normally expected in super duplex stainless steels. Additionally, a highly anisotropic, coarse microstructure was observed, which in combination with the introduced cold-work from the swaging process and potential stress raisers from design and machining could have facilitated crack initiation, ultimately leading to the failure of the component. This hypothesis was reinforced by the presence of secondary cracks along the main, brittle fracture surface. Furthermore, mechanical testing results showed a detrimental effect on the material’s properties due to the presence of residual hydrogen and the swaging operation.
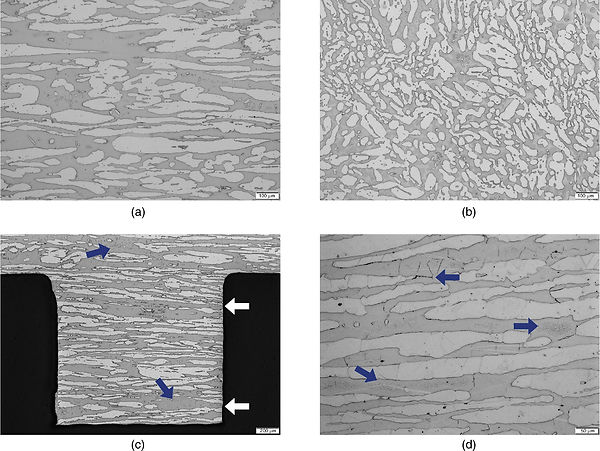
LOM of the dual phase SDSS swaged microstructure in the L-S plane for (a), (c), and (d) and S-T plane for (b). Samples in (a), (b), and (c) were etched with the Method A while the microstructure in (d) was revealed with the Method B.
Bright and dark phases correspond to austenitic and ferritic grains, respectively.
In (c), the white arrows indicate ferrite islands that extended from end-to-end of the castellation while the blue arrows show the equiaxed austenite phase present in clusters. Likewise, the arrows point to the location of suspected carbides and intergranular precipitates in (d).
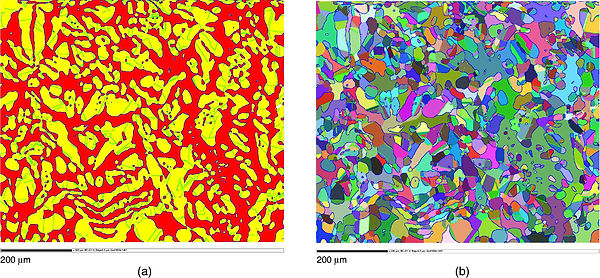
EBSD analysis of (fcc) austenite and (bcc) ferrite volume fraction. (a) Phase map. bcc: red, fcc: yellow. Blue lines: phase boundaries, black lines: grain boundaries (sample preparation artifacts removed). (b) Grains are plotted in random coloring. A comparison with (a) and (b) shows multiple grains within the same phase field. 60° twin boundaries are superimposed in lime green.
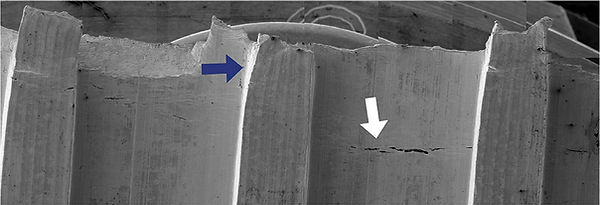
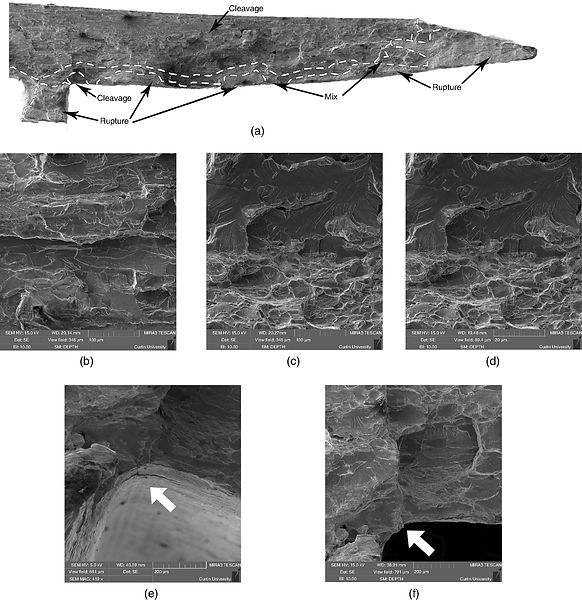
SE FE-SEM image showing secondary cracks (white arrow) and plastic deformation (dark arrow) on the internal surface.
SEM SE images of the fracture surface at
(a) the thin swaged end showing
(b) cleavage,
(c) cleavage/rupture mix, and
(d) dimple rupture.
(e) illustrates a secondary crack in the first castellation close to
(g) the fracture surface.
White arrows point to the secondary crack location.
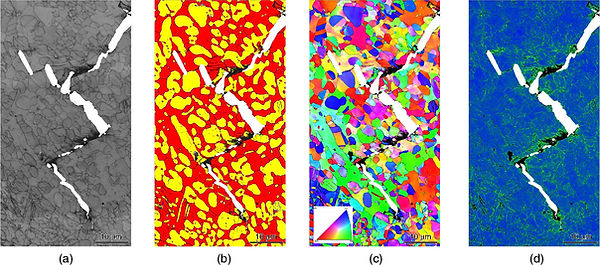
EBSD analysis of the cross section near the arrest location of the main crack indicated by the white box in Figure 7(b). The approximate area of the crack as seen in the Figure 8 is plotted in white. (a) BC map in grayscale and black represent the indexed and unindexed areas (i.e., lattice defects such as grain boundaries or deformation lines), respectively; (b) EBSD phase map where red: ferrite, yellow: austenite, and blue lines: phase boundaries; (c) Z direction IPF coloring orientation map; (d) KAM map indicating misorientation within the grains.
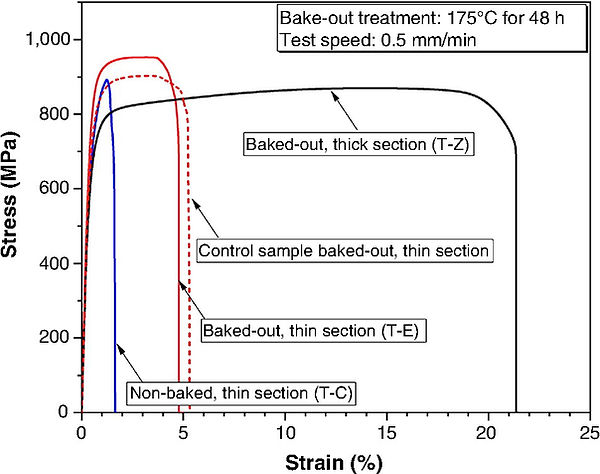
Stress-strain curves of UNS S32760 for as received (i.e., nonbaked) sample (T-C), samples from the thin section baked-out before (control sample) and after the flattening (T-E) and a baked-out sample from the thick portion of the swaged section (T-Z). The influence of residual hydrogen and swaging can be seen by the reduction of elongation to fracture and modulus of toughness for the four different conditions.